Monthly Ads Monitor
Free Google Ads script that generates monthly performance trends with year-over-year comparison. Automatic dashboard with dynamic filtering and email reports.
Your data never leaves your browser
Everything runs 100% client-side. Your CSV files and API responses are processed locally and never sent to any server. We have no access to your data — not even technically.
About this tool
Are you tracking your Google Ads performance month by month — and can you instantly see how this year compares to last year? This free script does it for you automatically.
Paste the script into Google Ads Scripts, run it once, and you get a professional spreadsheet dashboard with 2 years of monthly campaign data, year-over-year index comparison, and dynamic filters for campaign type and brand exclusion.
Every metric — clicks, CPC, cost, conversions, conversion value, and ROAS — is shown for both the current and previous year with a color-coded YoY index. Green means growth, red means decline. You can spot trends at a glance without opening Google Ads.
The dashboard uses locale-safe formulas that work in any Google Sheets language (English, Czech, German, etc.). Filters are live — change the dropdown and all numbers update instantly. No macros, no add-ons.
Optionally, the script sends an email summary after each run with last month's key metrics and a link to the spreadsheet. Schedule it to run on the 1st of each month and you'll always have fresh data waiting in your inbox.
Need weekly granularity instead? Use the Weekly Ads Monitor for ISO-week YoY comparison. For a deeper look at individual products, try the Product Performance Tracker.
What's included
- 2-year monthly performance data with YoY comparison
- Color-coded YoY index: green = growth, red = decline
- Dynamic campaign type filter (Search, Shopping, PMax, Display, Video)
- Brand campaign exclusion toggle
- Conversion value by conversion time tracking
- ROAS by conversion time analysis
- Locale-safe formulas (works in any Google Sheets language)
- Optional email report with last month's summary
- Professional formatting with conditional coloring
- 100% free — no payment, no registration, no limits
Who is this for
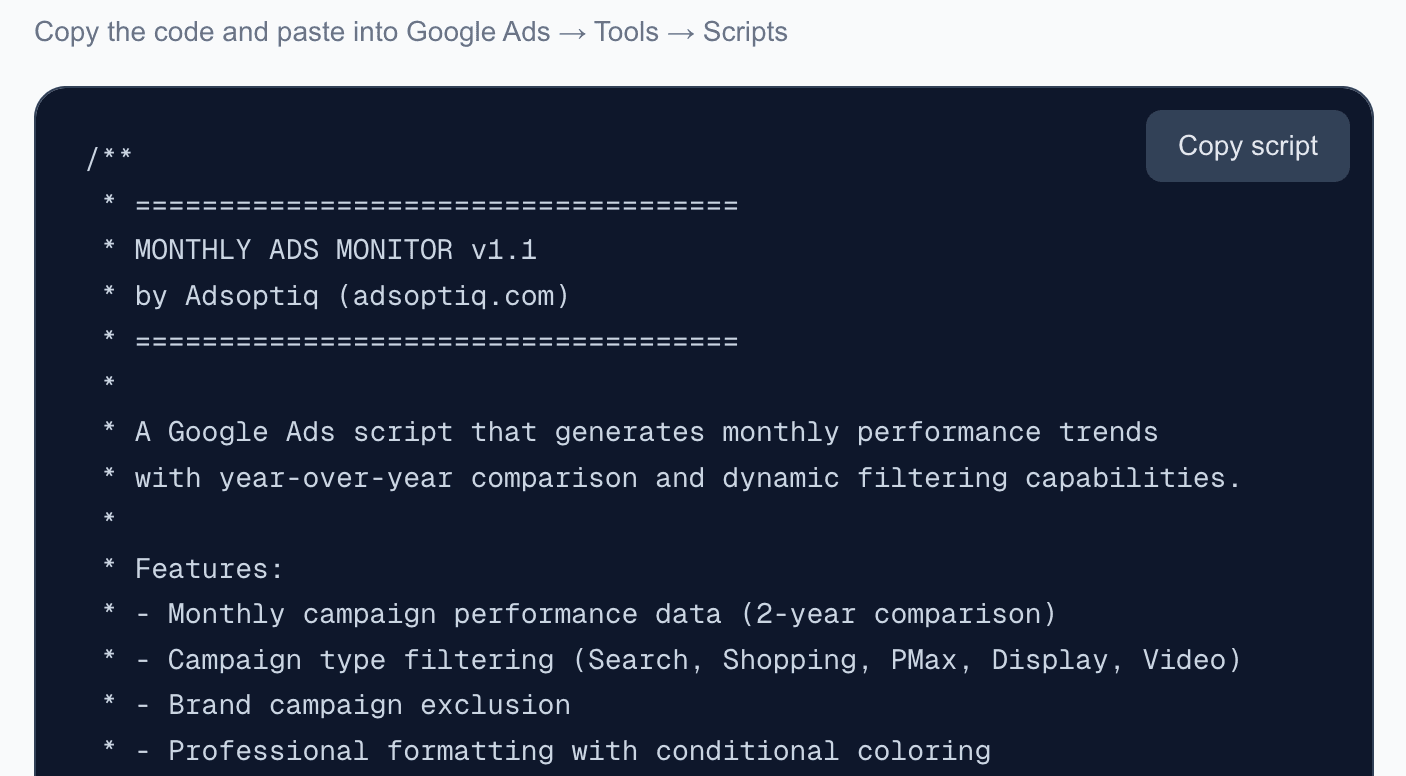
Get the script
Copy the code and paste into Google Ads → Tools → Scripts
Frequently asked questions
How do I install this script?
Copy the script code from this page. In Google Ads, go to Tools & Settings > Bulk Actions > Scripts > New script. Paste the code, fill in the CONFIG section (spreadsheet URL, optional email), authorize, and run.
Is this really free?
Yes, 100% free. No payment, no registration, no limits. Copy the code and use it as you like.
How often should I schedule it?
Once a month, ideally on the 1st. The script automatically calculates the date range from January of last year to the last complete month.
Does it work with any Google Sheets locale?
Yes. The script detects your spreadsheet's locale and uses the correct formula separator (comma for English, semicolon for European locales).
Can I filter by campaign type?
Yes. The dashboard includes a live dropdown filter for campaign types (Search, Shopping, Performance Max, Display, Video) and an option to exclude brand campaigns.
What metrics are tracked?
Clicks, Average CPC, Cost, Conversions, Conversion Value, Conversion Value (by conversion time), ROAS, and ROAS (by conversion time) — each with current year, previous year, and YoY index.
Can't find what you need?
We've spent 20+ years building companies, data pipelines, marketing systems, and reporting tools. If you have a specific challenge — reach out. We might already have a solution.
Free. No registration. No limits.
Related tools
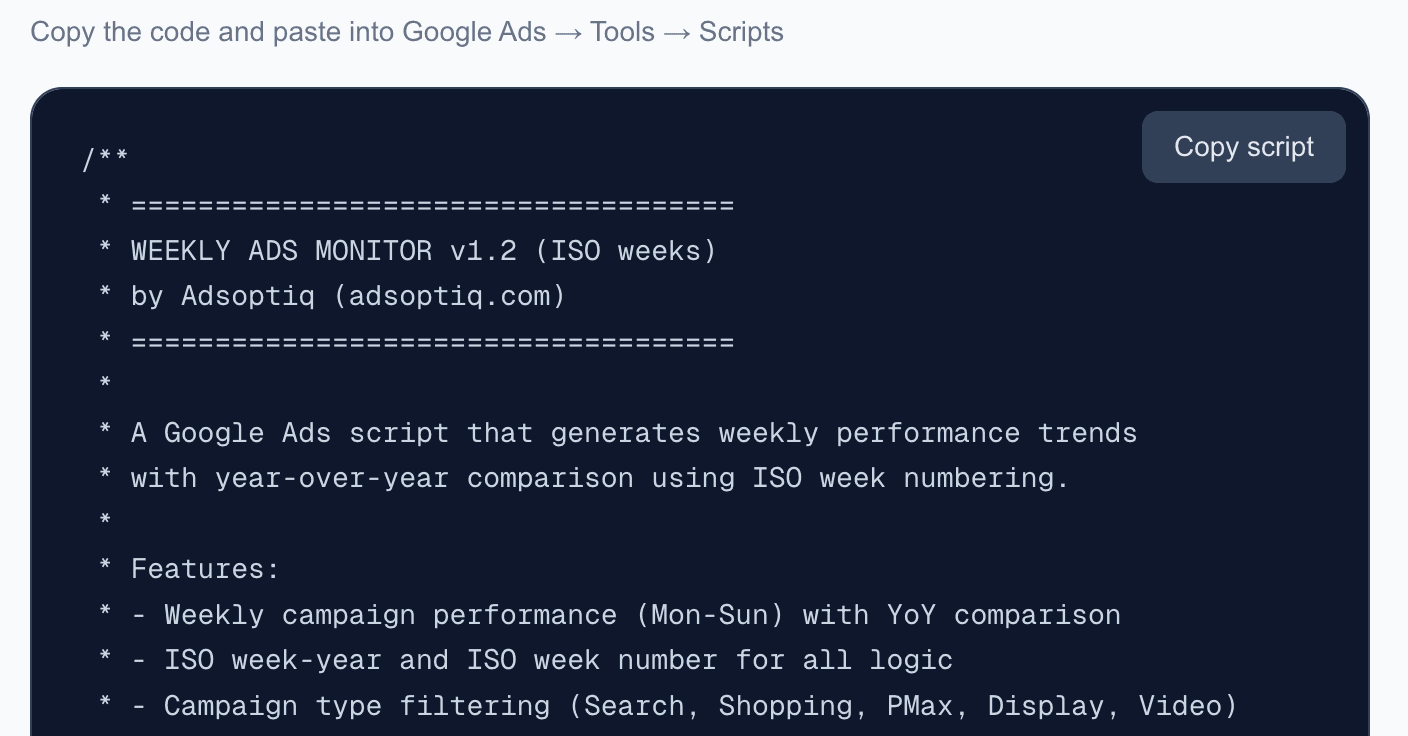
Weekly Ads Monitor
Free Google Ads script that generates weekly performance trends with ISO week-based year-over-year comparison. Automatic dashboard with dynamic filtering and email reports.

Product Performance Tracker
Free Google Ads script that analyzes Shopping product performance with month-over-month comparison, category aggregation, deterministic insights, trend tracking, and email alerts.
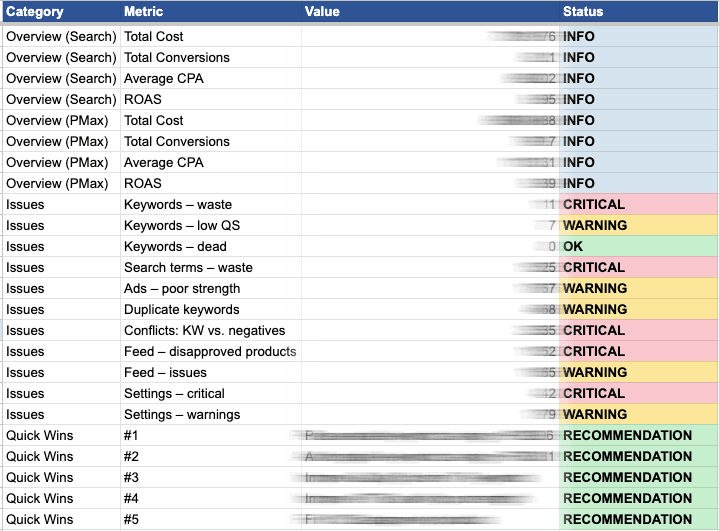
Google Ads Audit Script
Free Google Ads script that runs a comprehensive audit of your account — Search, PMax, Shopping feed, and settings — and outputs an 11-tab Google Sheet report with account-level overview, actionable findings, and Quick Wins.
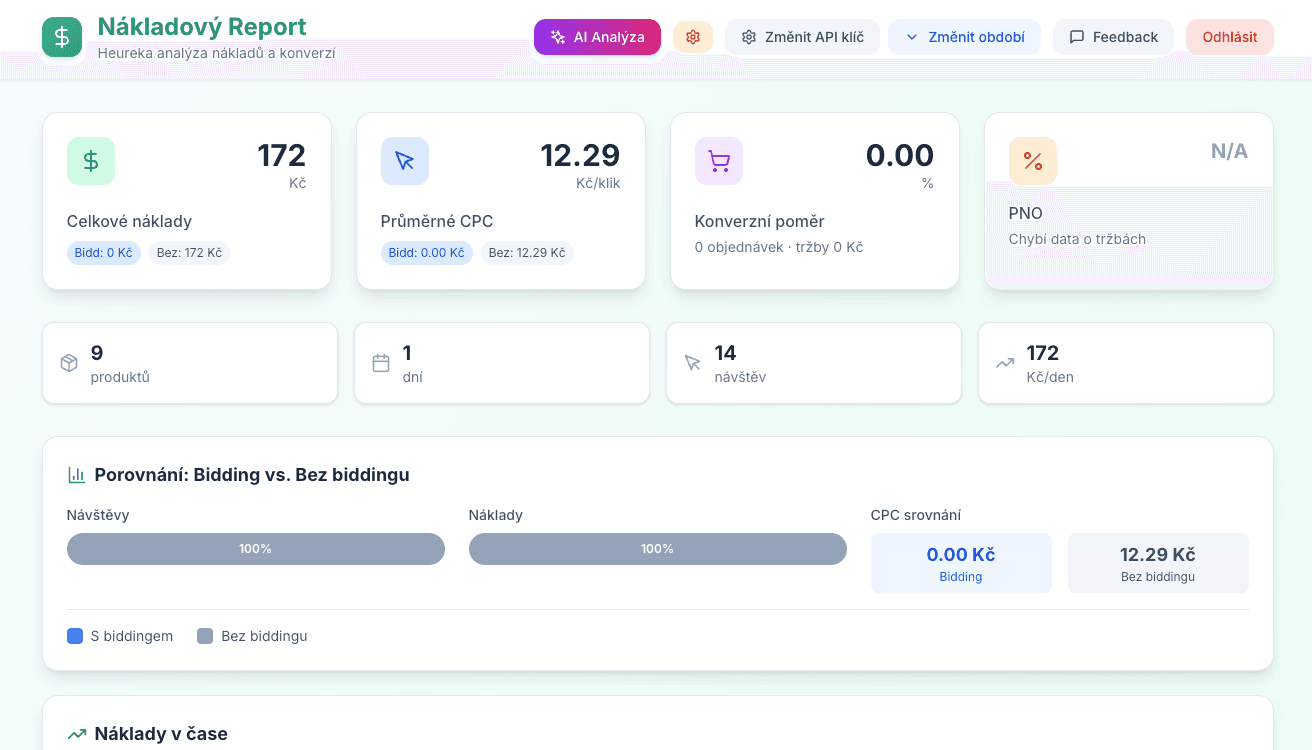
Heureka Cost Report
Cost analysis for Heureka.cz. Breakdown of spend per product, category, and day with optional AI assistance for optimization.