Product Performance Tracker
Free Google Ads script that analyzes Shopping product performance with month-over-month comparison, category aggregation, deterministic insights, trend tracking, and email alerts.

Your data never leaves your browser
Everything runs 100% client-side. Your CSV files and API responses are processed locally and never sent to any server. We have no access to your data — not even technically.
About this tool
Do you know which Shopping products are growing, which are declining, and which disappeared entirely since last month? This free script gives you a complete month-over-month product performance analysis — automatically.
Paste the script into Google Ads Scripts, run it once a month, and get a multi-tab spreadsheet with raw product data, MoM performance changes, new and inactive product lists, category-level aggregation, and calculated insights — all with zero manual work.
Every product is tracked with extended metrics: impressions, clicks, CTR, cost, CPA, conversions, conversion value, ROAS, and an impact score. The script compares the last two complete months and highlights what changed — including which categories are growing or declining, which products had the biggest ROAS swings, and how much revenue was lost from inactive products.
A persistent Trend History tab accumulates data across months, so you can chart long-term performance trends. Historical tabs are never overwritten — each month gets its own dated tabs.
The script also sends email alerts when ROAS or impressions drop below configurable thresholds, and flags inactive products that previously generated revenue. Optionally, you can plug in an OpenAI API key for AI-generated recommendations.
Want to auto-label your best and worst performers directly in Merchant Center? Use the GMC Product Labeler to push labels into your Shopping campaigns. For account-level trends, add the Monthly Ads Monitor.
What's included
- Month-over-month product performance comparison
- Extended metrics: CTR, CPA, ROAS, Impact Score per product
- New product detection — products appearing for the first time
- Inactive product detection — products that stopped running
- Category-level aggregation (Product Type L1/L2)
- Deterministic calculated insights (no AI required)
- Historical tracking with dated tabs (non-destructive)
- Persistent Trend History tab for long-term charting
- Email alerts for ROAS drops, impressions drops, and lost revenue
- Feed product comparison — find products not running in any campaign
- Optional OpenAI-powered insights (opt-in via API key)
- Configurable minimum impressions threshold
- 100% free — no payment, no registration, no limits
Who is this for
Get the script
Copy the code and paste into Google Ads → Tools → Scripts
Frequently asked questions
How do I install this script?
Copy the script code from this page. In Google Ads, go to Tools & Settings > Bulk Actions > Scripts > New script. Paste the code, fill in the CONFIG section (spreadsheet URL, email), authorize, and run.
Is this really free?
Yes, 100% free. No payment, no registration, no limits. Copy the code and use it in any Google Ads account.
How often should I run it?
Once a month, ideally on the 1st-3rd of the month. The script automatically compares the last two complete months.
Will it overwrite my previous data?
No. Each month creates new dated tabs (e.g. 'Raw Data 2025-03'). Re-running the same month updates that month's tabs only. The Trend History tab accumulates data across all runs.
What's the OpenAI integration?
Completely optional. If you add an OpenAI API key to the config, the script generates AI-powered recommendations based on your data. Without it, you still get full deterministic insights.
Does it work with Performance Max campaigns?
Yes. The script pulls data from the shopping_performance_view which covers both standard Shopping and Performance Max campaigns.
Can't find what you need?
We've spent 20+ years building companies, data pipelines, marketing systems, and reporting tools. If you have a specific challenge — reach out. We might already have a solution.
Free. No registration. No limits.
Related tools
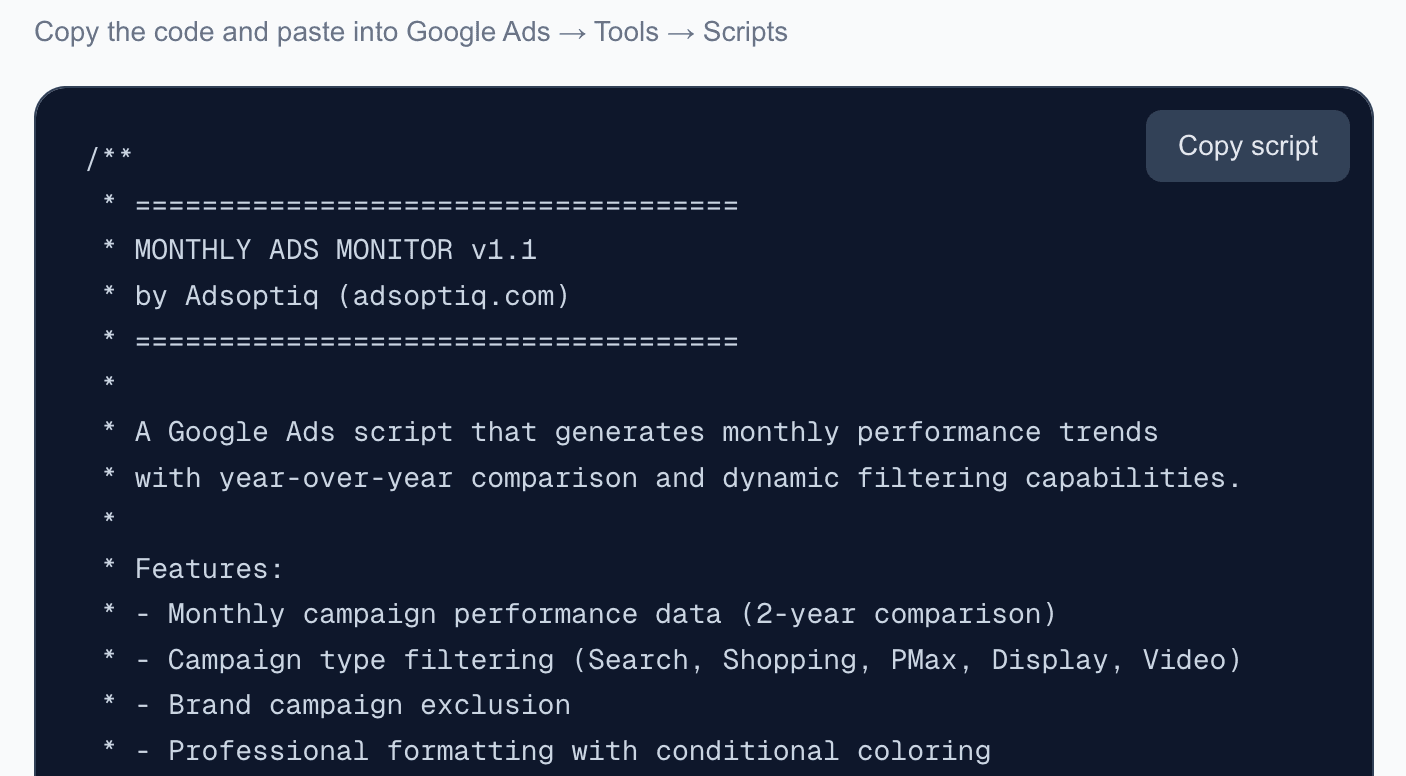
Monthly Ads Monitor
Free Google Ads script that generates monthly performance trends with year-over-year comparison. Automatic dashboard with dynamic filtering and email reports.
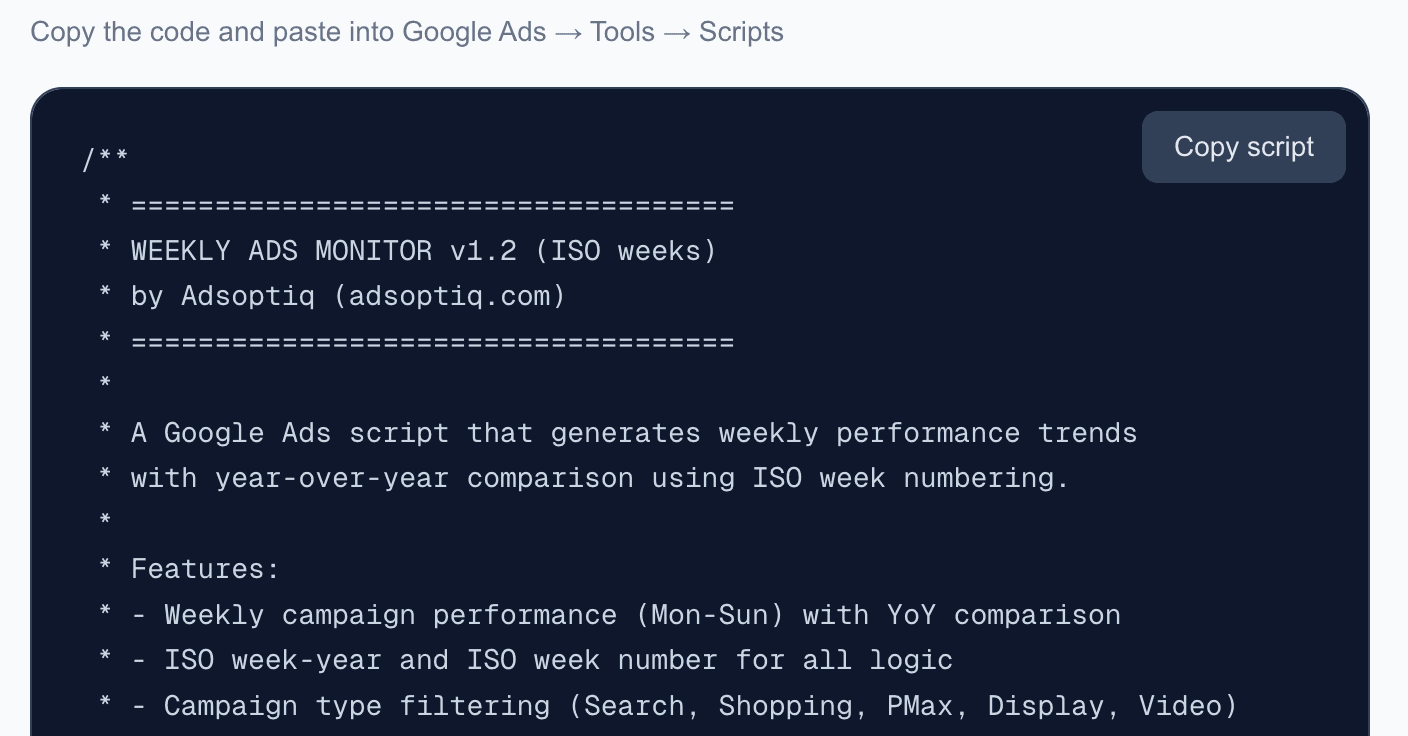
Weekly Ads Monitor
Free Google Ads script that generates weekly performance trends with ISO week-based year-over-year comparison. Automatic dashboard with dynamic filtering and email reports.
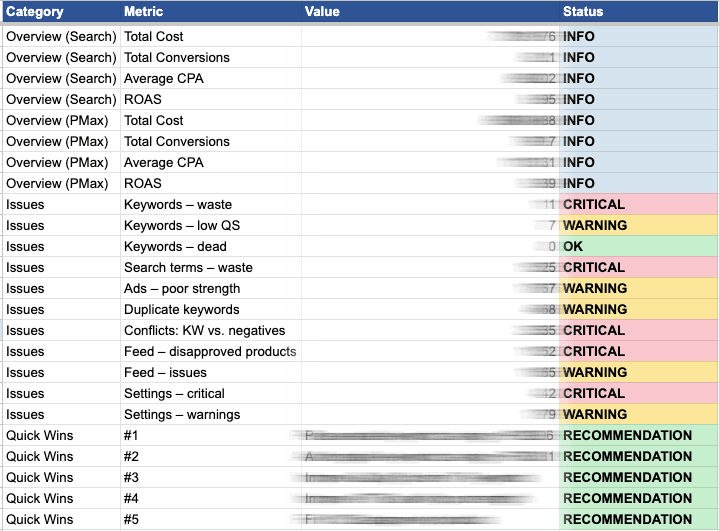
Google Ads Audit Script
Free Google Ads script that runs a comprehensive audit of your account — Search, PMax, Shopping feed, and settings — and outputs an 11-tab Google Sheet report with account-level overview, actionable findings, and Quick Wins.
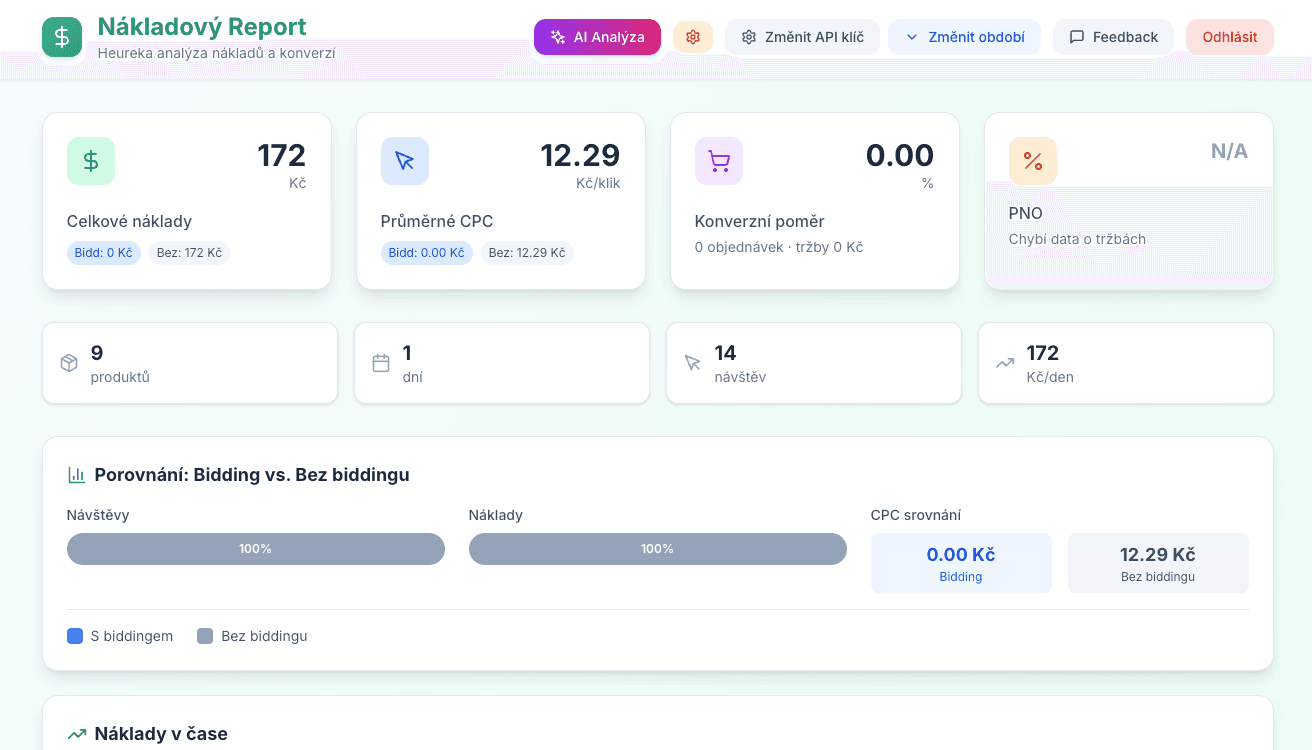
Heureka Cost Report
Cost analysis for Heureka.cz. Breakdown of spend per product, category, and day with optional AI assistance for optimization.